
There are several performance monitoring tools in Linux that allow you to monitor resource usage on the system. These tools can aid in debugging Linux System Performance issues and troubleshooting them.
In this article, we will discuss some of the best tools for monitoring Linux performance. The commands listed below are available in all Linux distributions and some of them are installed by default on the system.
1. top
The top command in Linux provides a dynamic real-time view of the running system. It displays system summary information and a list of processes currently managed by the Linux Kernel.
Run the following command to list all running processes.
top
It opens an interactive interface showing processes where you can use different interactive commands.
Output:
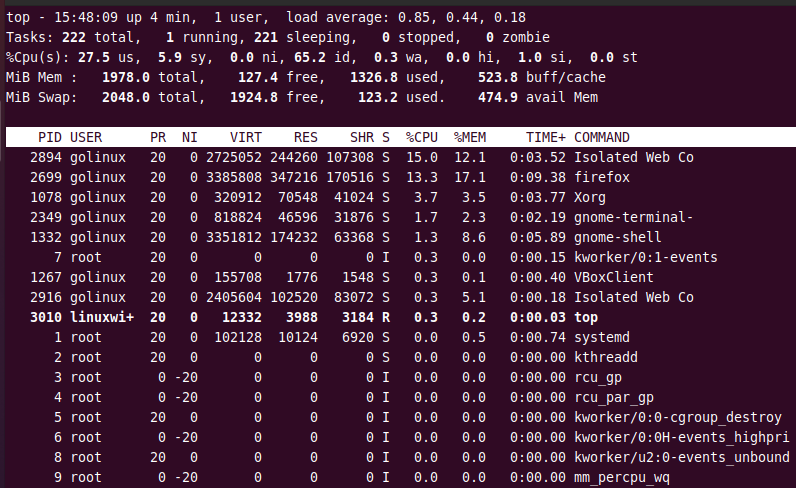
Pressing q will exit the interactive command mode.
2. vmstat
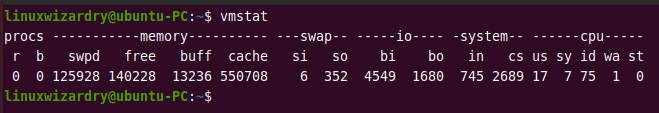
vmstat is a monitoring tool that shows information about processes, memory, paging, block IO, traps, and CPU activity.
Type the command below to report virtual memory statistics.
vmstat
Output:
3. iostat
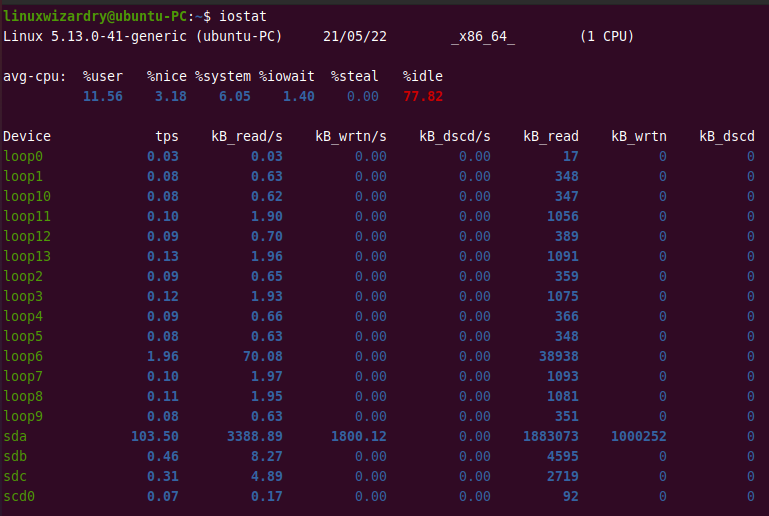
The iostat command displays statistics of CPU, input/output devices, partitions, and network filesystem (NFS). This command is not available by default in the Linux system. You can install it by using the following command according to your Linux distribution.
For Debian/Ubuntu and Mint
sudo apt install sysstat
For CentOS/RHEL/Fedora/Rocky Linux & AlmaLinux
sudo dnf install sysstat
For Arch Linux
sudo pacman -S sysstat
To monitor CPU and I/O statistics, enter the following command.
iostat
Output:
4. Tcpdump
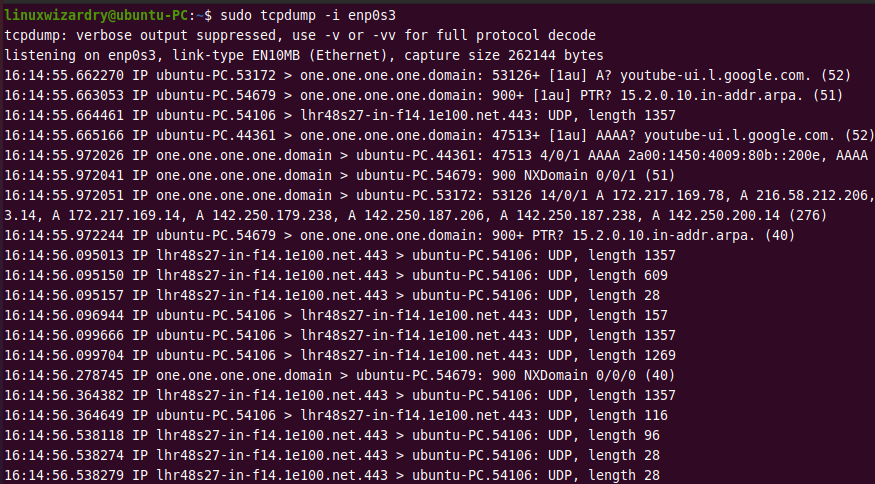
tcpdump command is used to dump traffic on a network. It is a network packet analyzer tool which is used to capture TCP/IP packets that are received or sent over a network.
tcpdump
Output:
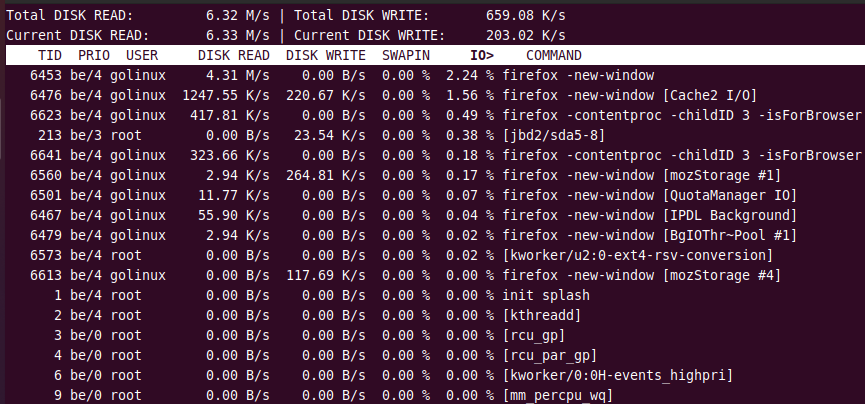
5. iotop
iotop is a top-like tool that is used for monitoring I/O usage on the disk. It displays a table of current I/O usage by processes or threads on the system.
iotop is not installed by default on the system. You can install it by using the following command.
For Debian/Ubuntu and Mint
sudo apt install iotop
For CentOS/RHEL/Fedora/Rocky Linux & AlmaLinux
sudo dnf install iotop
For Arch Linux
sudo pacman -S iotop
To monitor CPU and I/O statistics, enter the following command.
iotop
Output:
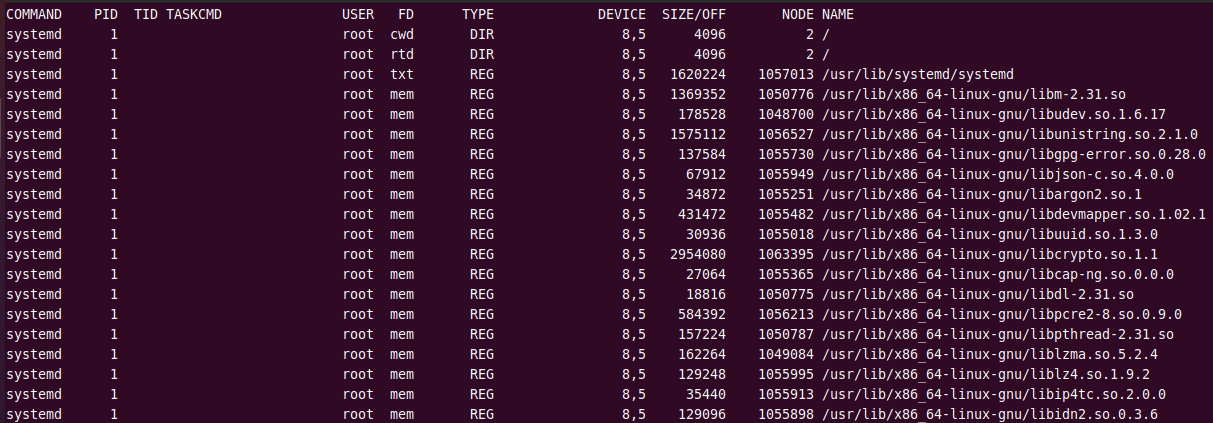
6. lsof
lsof command displays the list of all open files and processes.
sudo lsof
Output:
7. htop
htop is similar to the top command. It displays all the processes running on the system in an interactive interface. You can use shortcut keys, scroll the process list, and set vertical and horizontal views of the processes.
htop
Output:
 By default, htop is not available on the Linux system. You have to install it using the package manager tool.
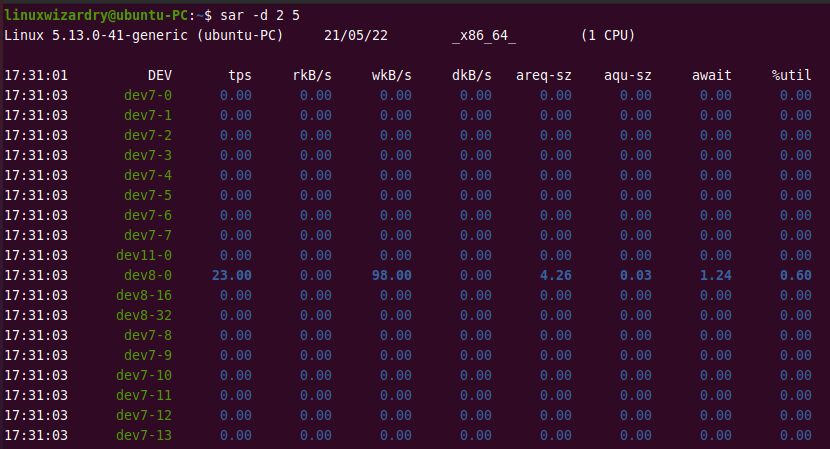
8. sar
System Activity Report (SAR) is a command-line utility used for real-time system monitoring in Linux. When sar command is used with -d option, it displays I/O device status.
The following command can be used to monitor disk I/O performance every 2 seconds. 5 lines are displayed.
sar -d 2 5
Output:
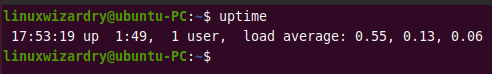
9. uptime
uptime is used to know how long the system has been running. It displays one-line information about the current time, the system’s total running time, the number of users currently logged on, and the system load averages for the past 1, 5, and 15 minutes.
uptime
Output:
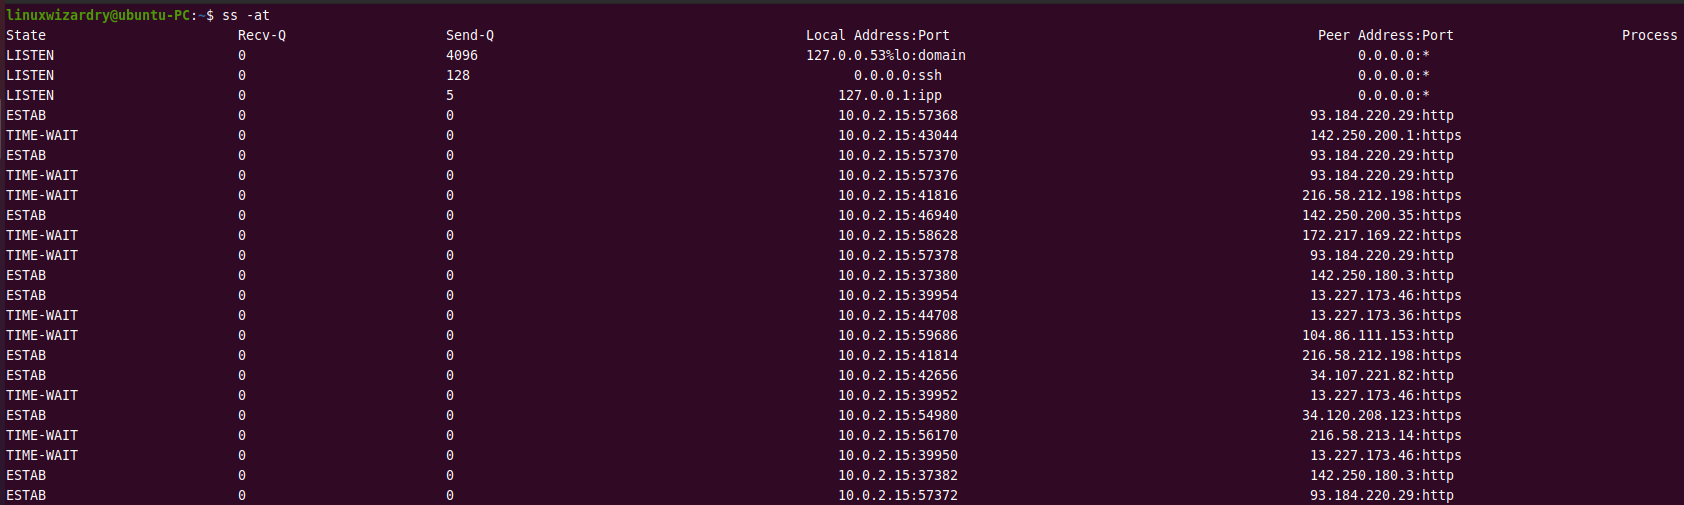
10. ss
ss is a command-line utility to dump socket statistics in Linux. It is considered a replacement for the netstat tool.
You can use this command to view all sockets, listening sockets, socket memory usage, processes using socket, and detailed socket information. It displays statistics for PACKET, TCP, UDP, DCCP, RAW, and UNIX domain sockets.
The following command displays all TCP sockets.
ss -at
Output:
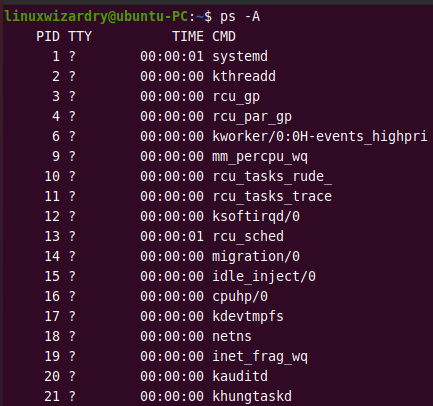
11. ps
The ps command displays information about currently running processes on the system.
To list all running processes, use the ps command with -A or -e flag.
ps -A
OR
ps -e
Output:
The PID indicates the process ID and the CMD displays the commands that started the process.
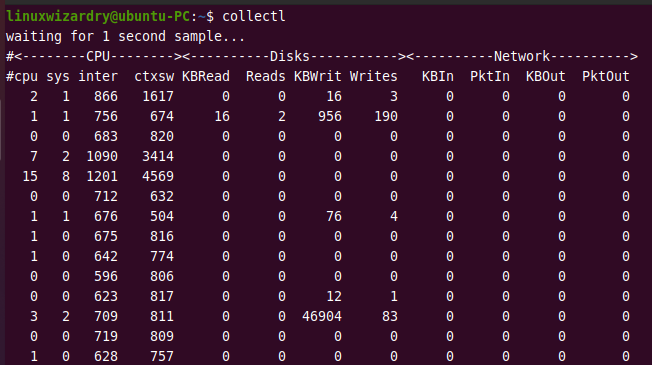
12. collectl
collectl is an all-in-one performance monitoring tool that collects data describing the current system status. It collects information about Linux system resources such as CPU usage, disk usage, network, memory, sockets, and others.
collectl is not available by default on the Linux system. You can install it using the following command.
For Debian/Ubuntu and Mint
sudo apt install collectl
For CentOS/RHEL/Fedora/Rocky Linux & AlmaLinux
sudo dnf install collectl
For Arch Linux
sudo pacman -S collectl
To monitor CPU usage, disk performance, and network, run the following command.
collectl
Output:
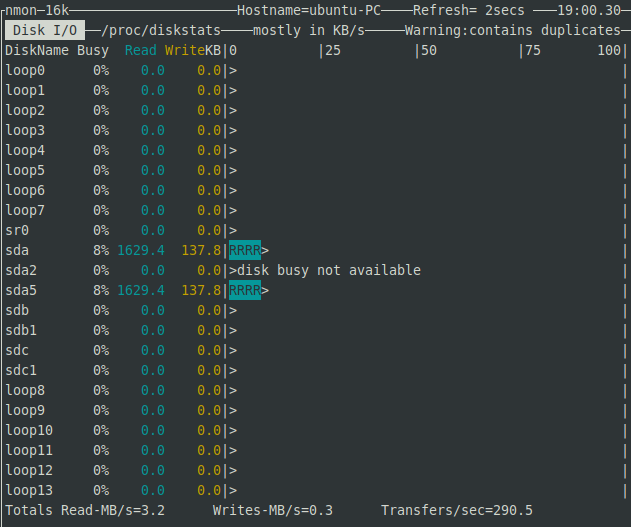
13. nmon
nmon is a short form for Nigel’s performance Monitor. It can display information about CPU, memory, network, disks, file systems, NFS, top processes, and resources.
You can install nmon using the package manager tool of your system.
For Debian/Ubuntu and Mint
sudo apt install nmon
For CentOS/RHEL/Fedora/Rocky Linux & AlmaLinux
sudo dnf install nmon
For Arch Linux
sudo pacman -S nmon
To monitor disk I/O performance, run the following command and press d.
nmon
Output:
14. atop
atop is yet another powerful and interactive monitor to view the load on a Linux system. It can display the CPU, memory, disk, and network performance. It also shows which processes are responsible for the indicated load in terms of CPU and memory load.
You can use the following commands to install atop on your Linux system.
For Debian/Ubuntu and Mint
sudo apt install atop
For CentOS/RHEL/Fedora/Rocky Linux & AlmaLinux
sudo dnf install atop
For Arch Linux
sudo pacman -S atop
To monitor CPU, memory, disk, and network performance, run the command below.
atop
Output:
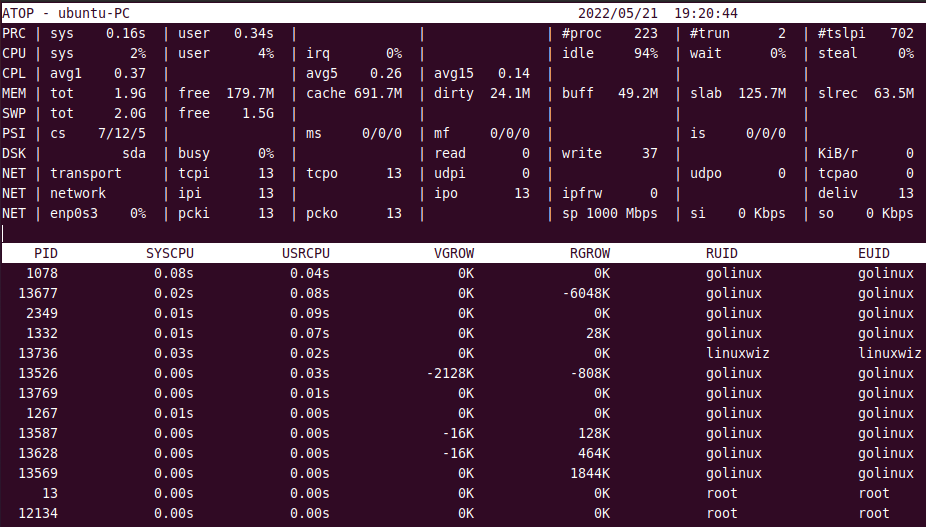
To view only disk-related output, you have to press d.
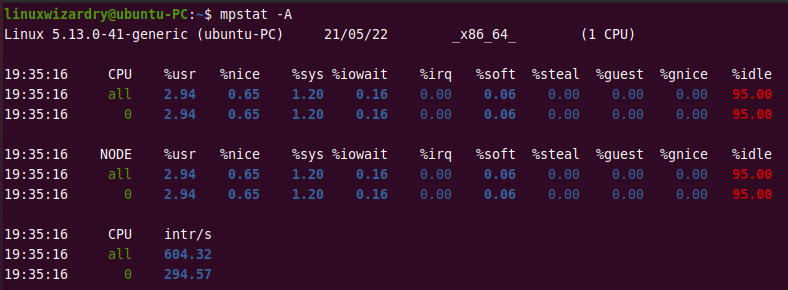
15. mpstat
mpstat is a command-line tool to display statistics about processors on a Linux system. It displays information for each available processor.
The following command shows all statistics about processors.
mpstat -A
Output:
Additional Tools
There are a few more tools that you can use to monitor the performance of the Linux system. Some of them are:
- monit: It is used for managing and monitoring processes, files, directories and filesystems on a Unix system.
- Nagios: It is a popular tool used for monitoring Linux operating systems and remote Linux/Windows hosts.
- strace: It is a useful tool to trace system calls and signals.
- free: It shows the total amount of free and used memory in the system
- pmap: It displays the memory map of a process.
- iptraf: It is an IP LAN monitor that shows various network information including TCP, UDP, Ethernet load, node stats, IP checksum errors, etc.
- NetHogs: It is a small ‘net top’ tool that groups bandwidth per process.
- iftop: It displays a table of bandwidth usage on an interface by hosts.
- glances: It is an open-source monitoring tool that aims to provide maximum information on the small screen. It shows details about CPU, Load, Memory, Network rate, Disk IO, file system, and process. It also works in client/server mode.
Conclusion
In this tutorial, you have learned about various performance monitoring tools in Linux. These tools can check CPU utilization, disk I/O performance, memory usage, and network performance.
Which tools do you use the most to monitor your Linux system performance? Have we missed any important monitoring tools on the list? Let us know in the comment section below.